Lap times chart
This plot gives a great immediate insight into the actual race pace and the different tire degradation that drivers and teams suffered. This plot should be coupled with the plot that we produced for the FP1 and FP2 where was obvious that the Red Bulls and the Aston Martin had an astonishing race pace.
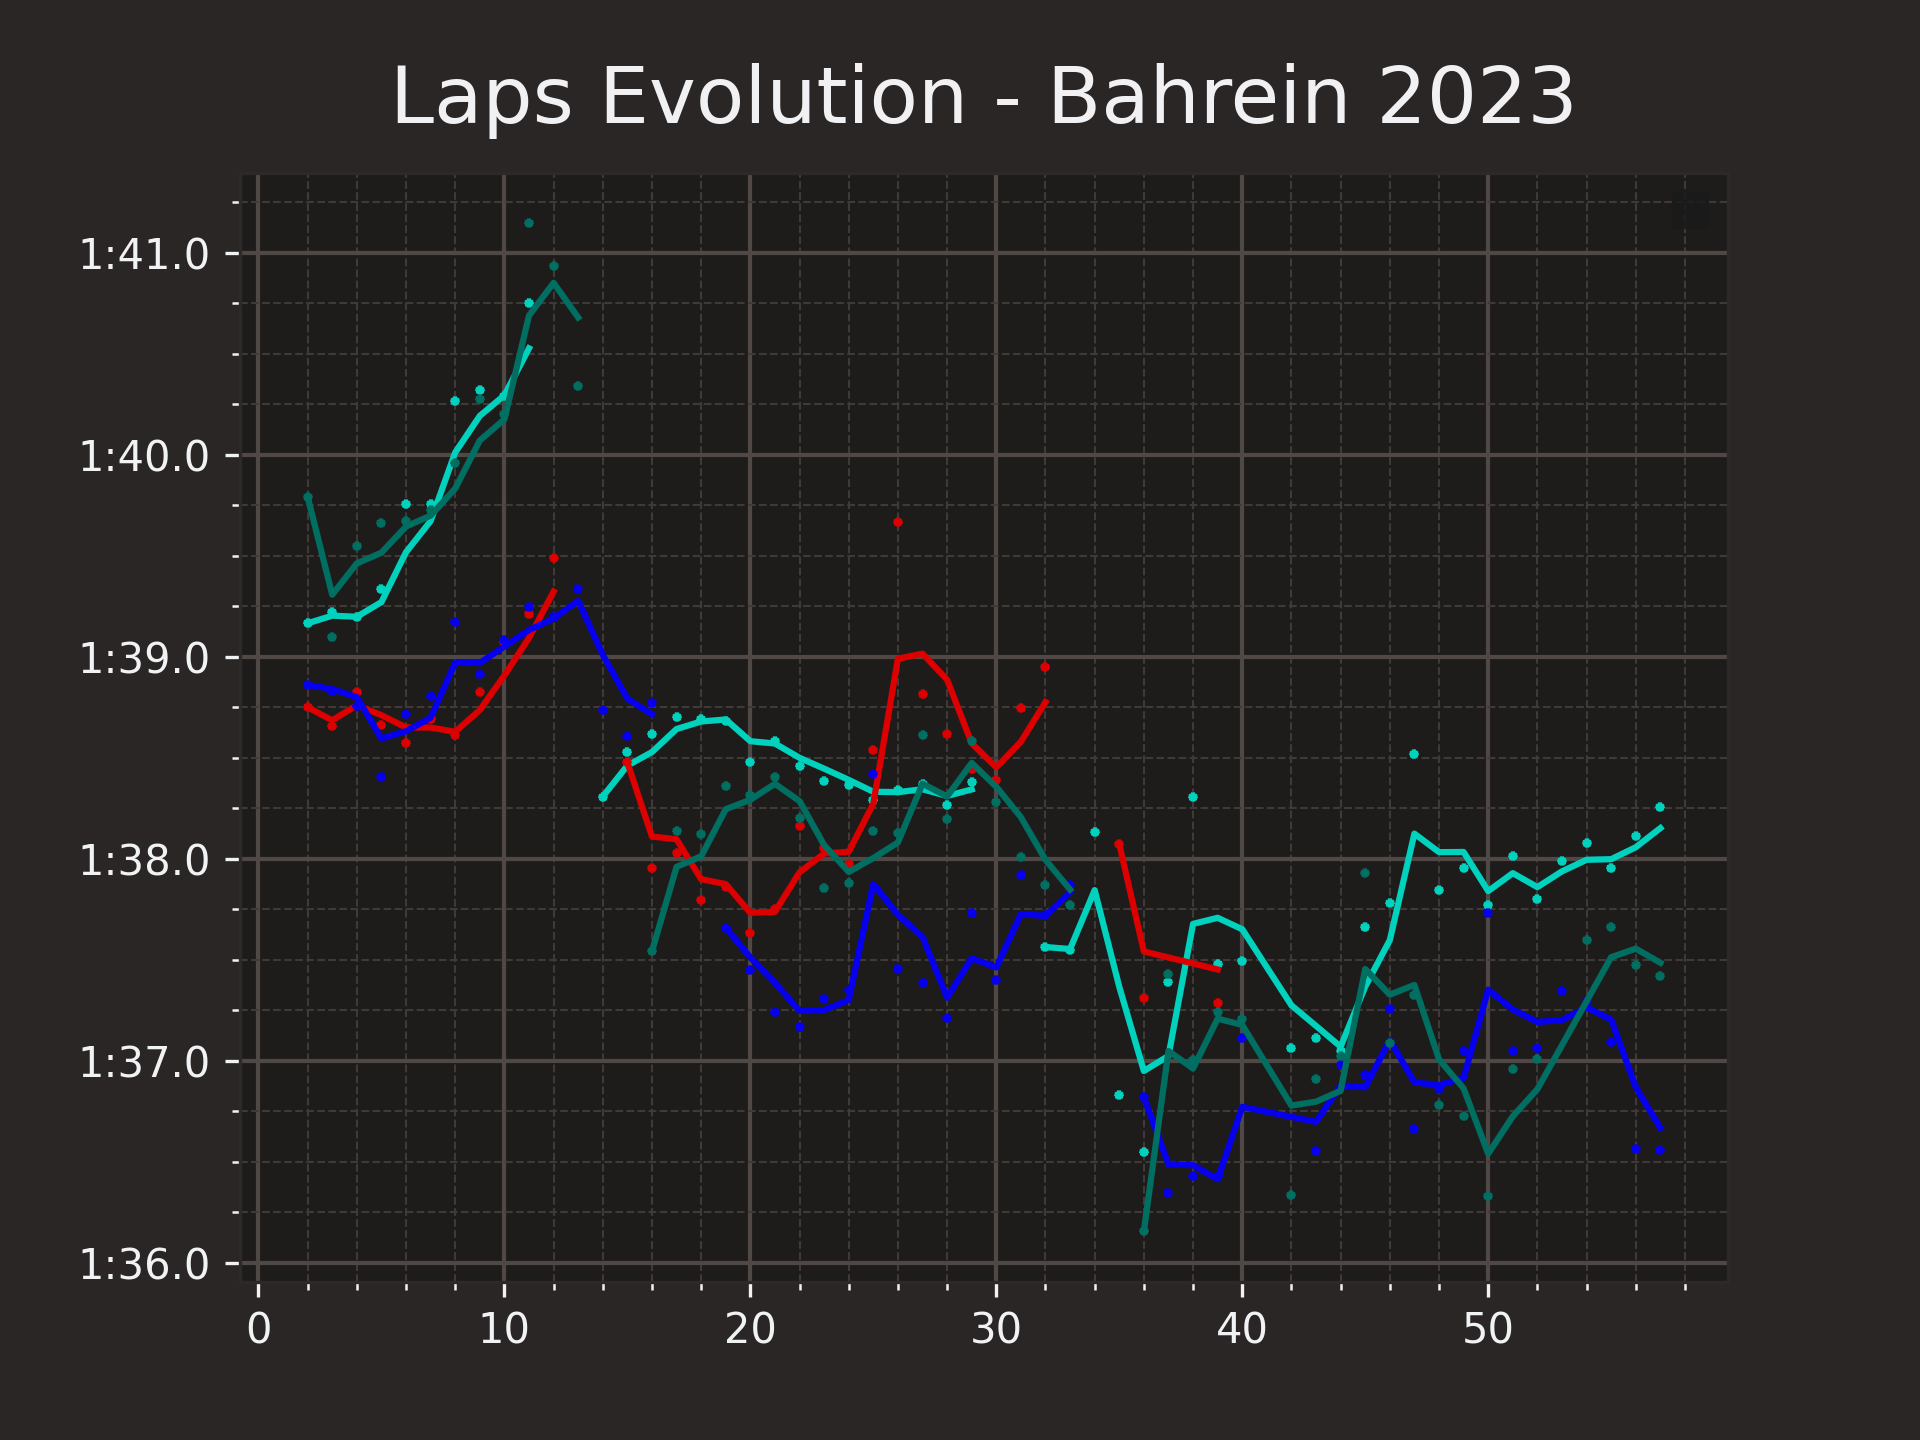 Race pace of Leclerc, Perez, Hamilton and Alonso.
It is immediately noticeable that in the first stint both Alonso and Perez had much more pace than those in front of them (in fact, as soon as Leclerc and Hamilton pitted, Perez and Alonso lowered their lap times). The spike in Leclerc’s second stint corresponds to Perez’s overtake.
Note: Inlap, Outlap and VSC times are not considered.
Ferrari 2023 vs. Ferrari 2022
There has been a lot of talk about Ferrari’s setback compared to the 2022 car. I tried to look at some data, and while data seems to support this thesis, plots need to be taken cum grano salis (see below).
The big Ferrari disappointment is even more striking if we compare 2023 Leclerc’s lap times with the 2022 ones.
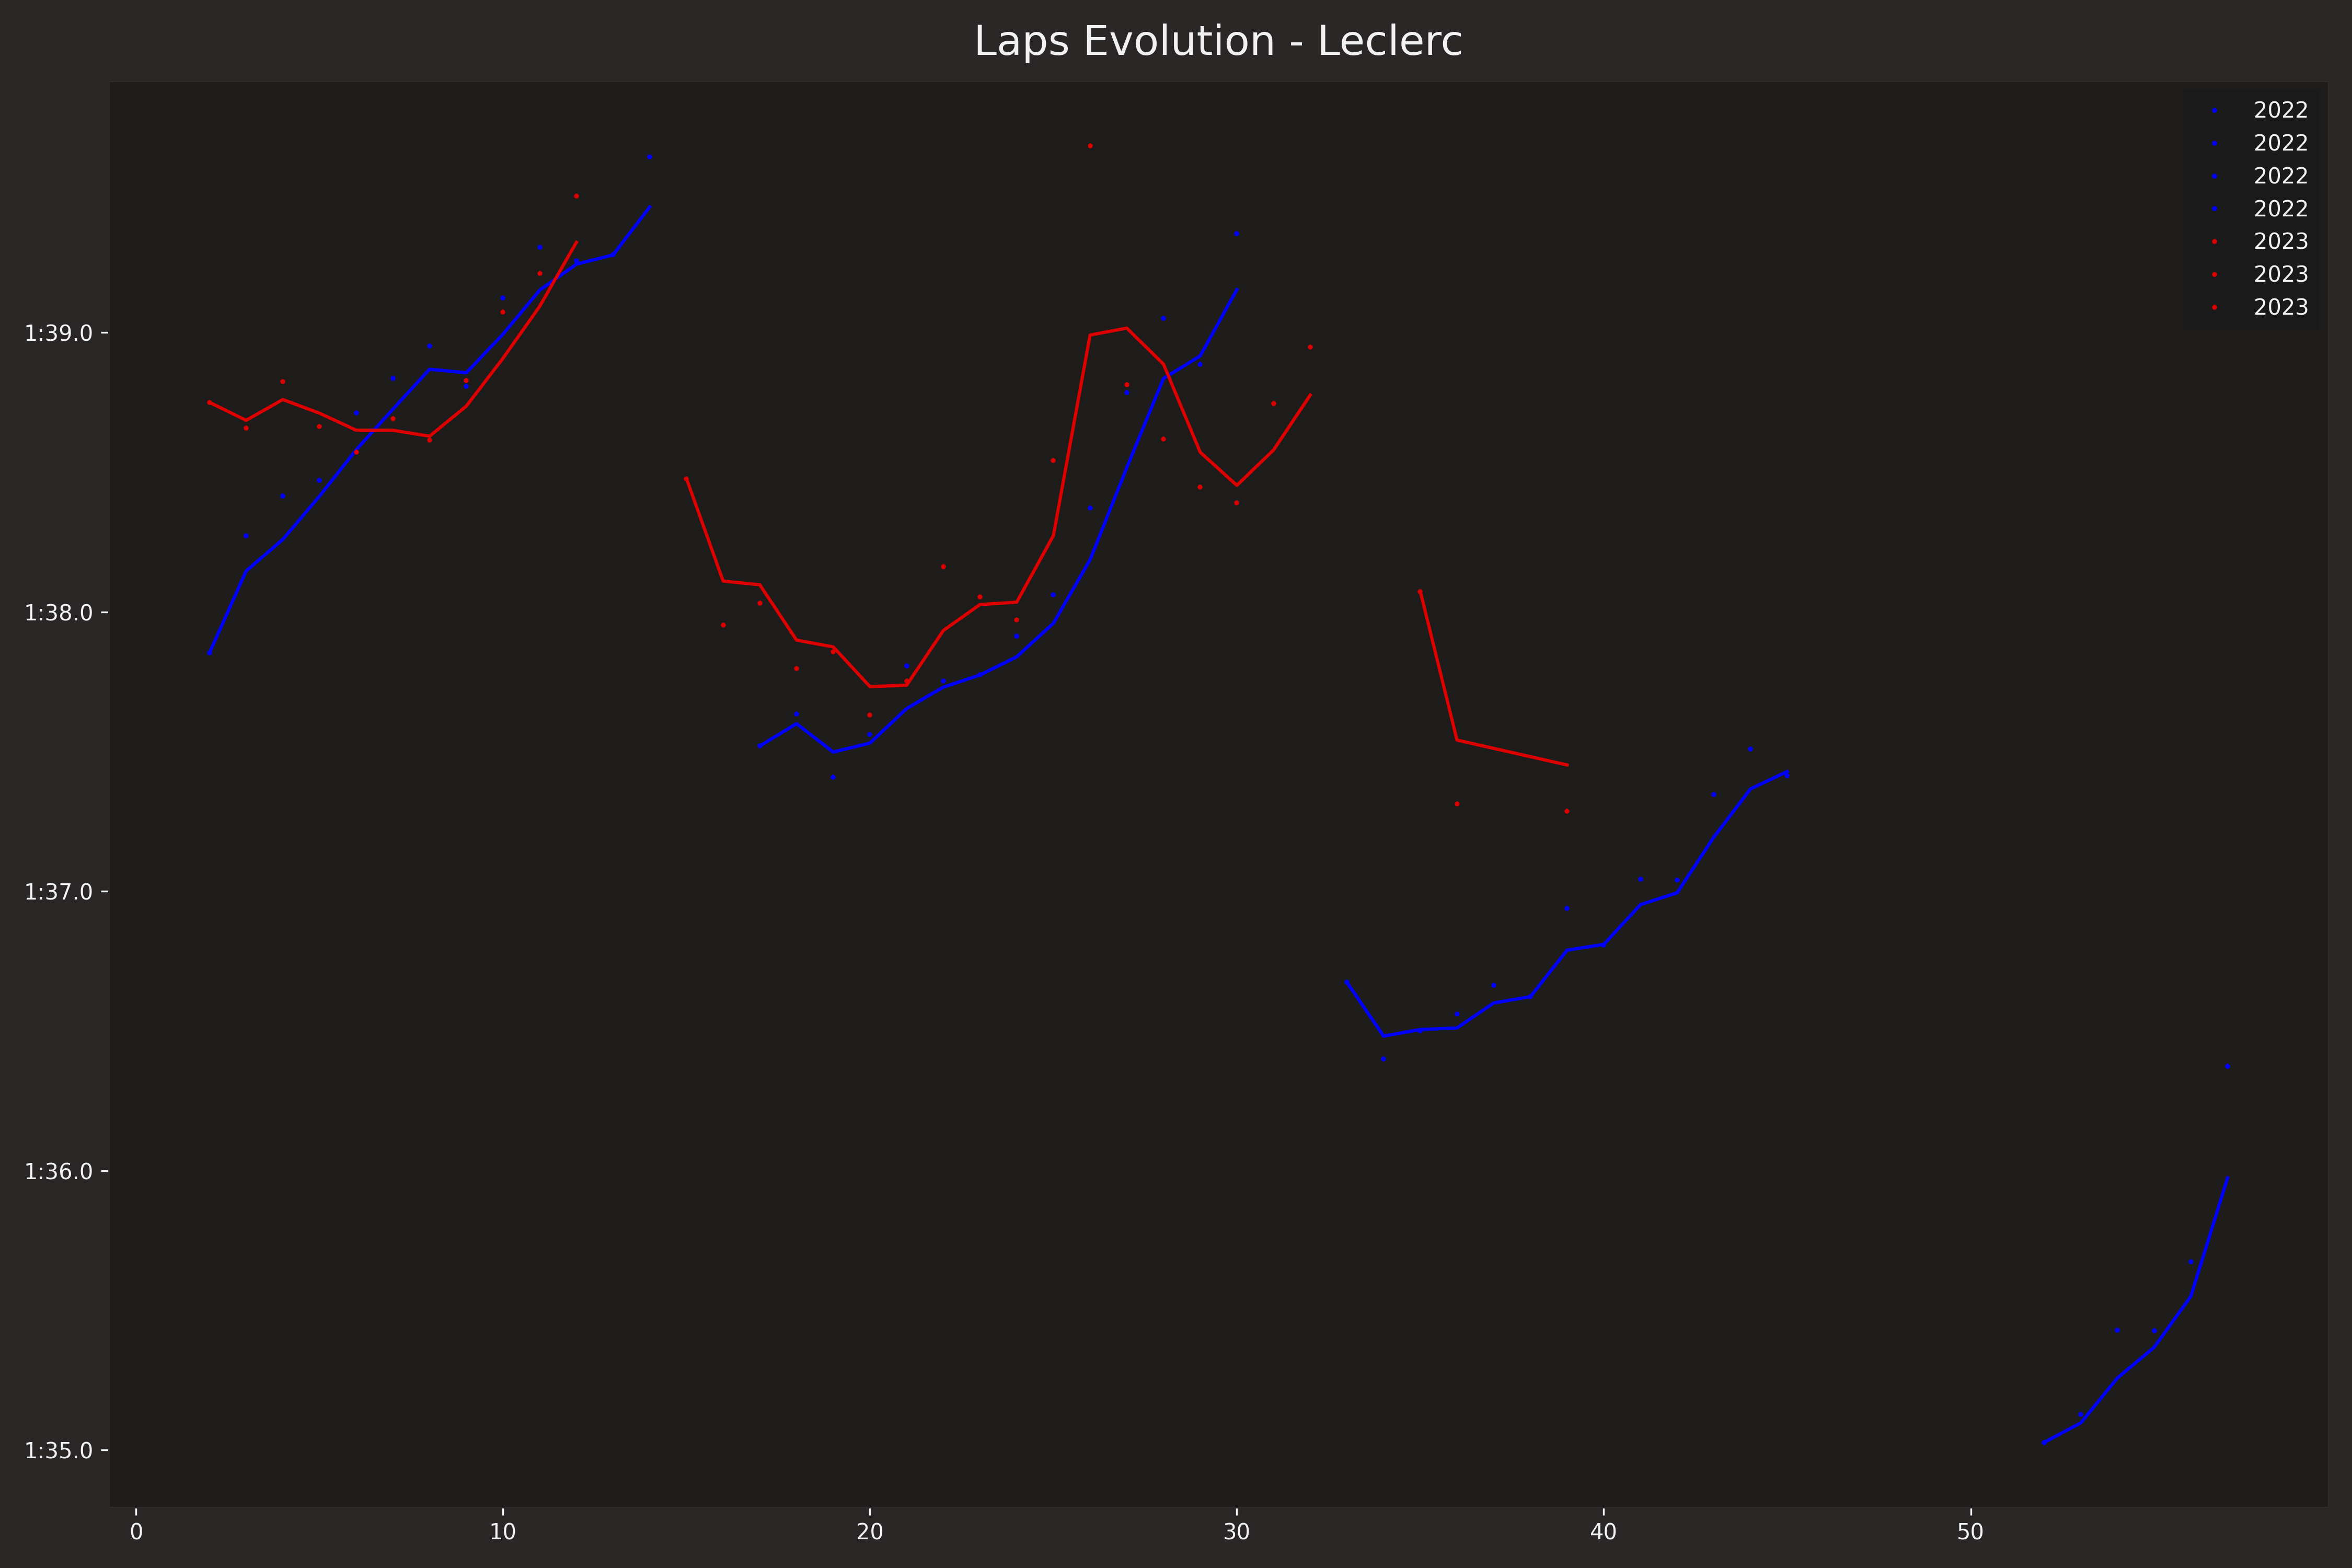 Comparison lap times Leclerc 2023 (red) vs 2022 (blue)
 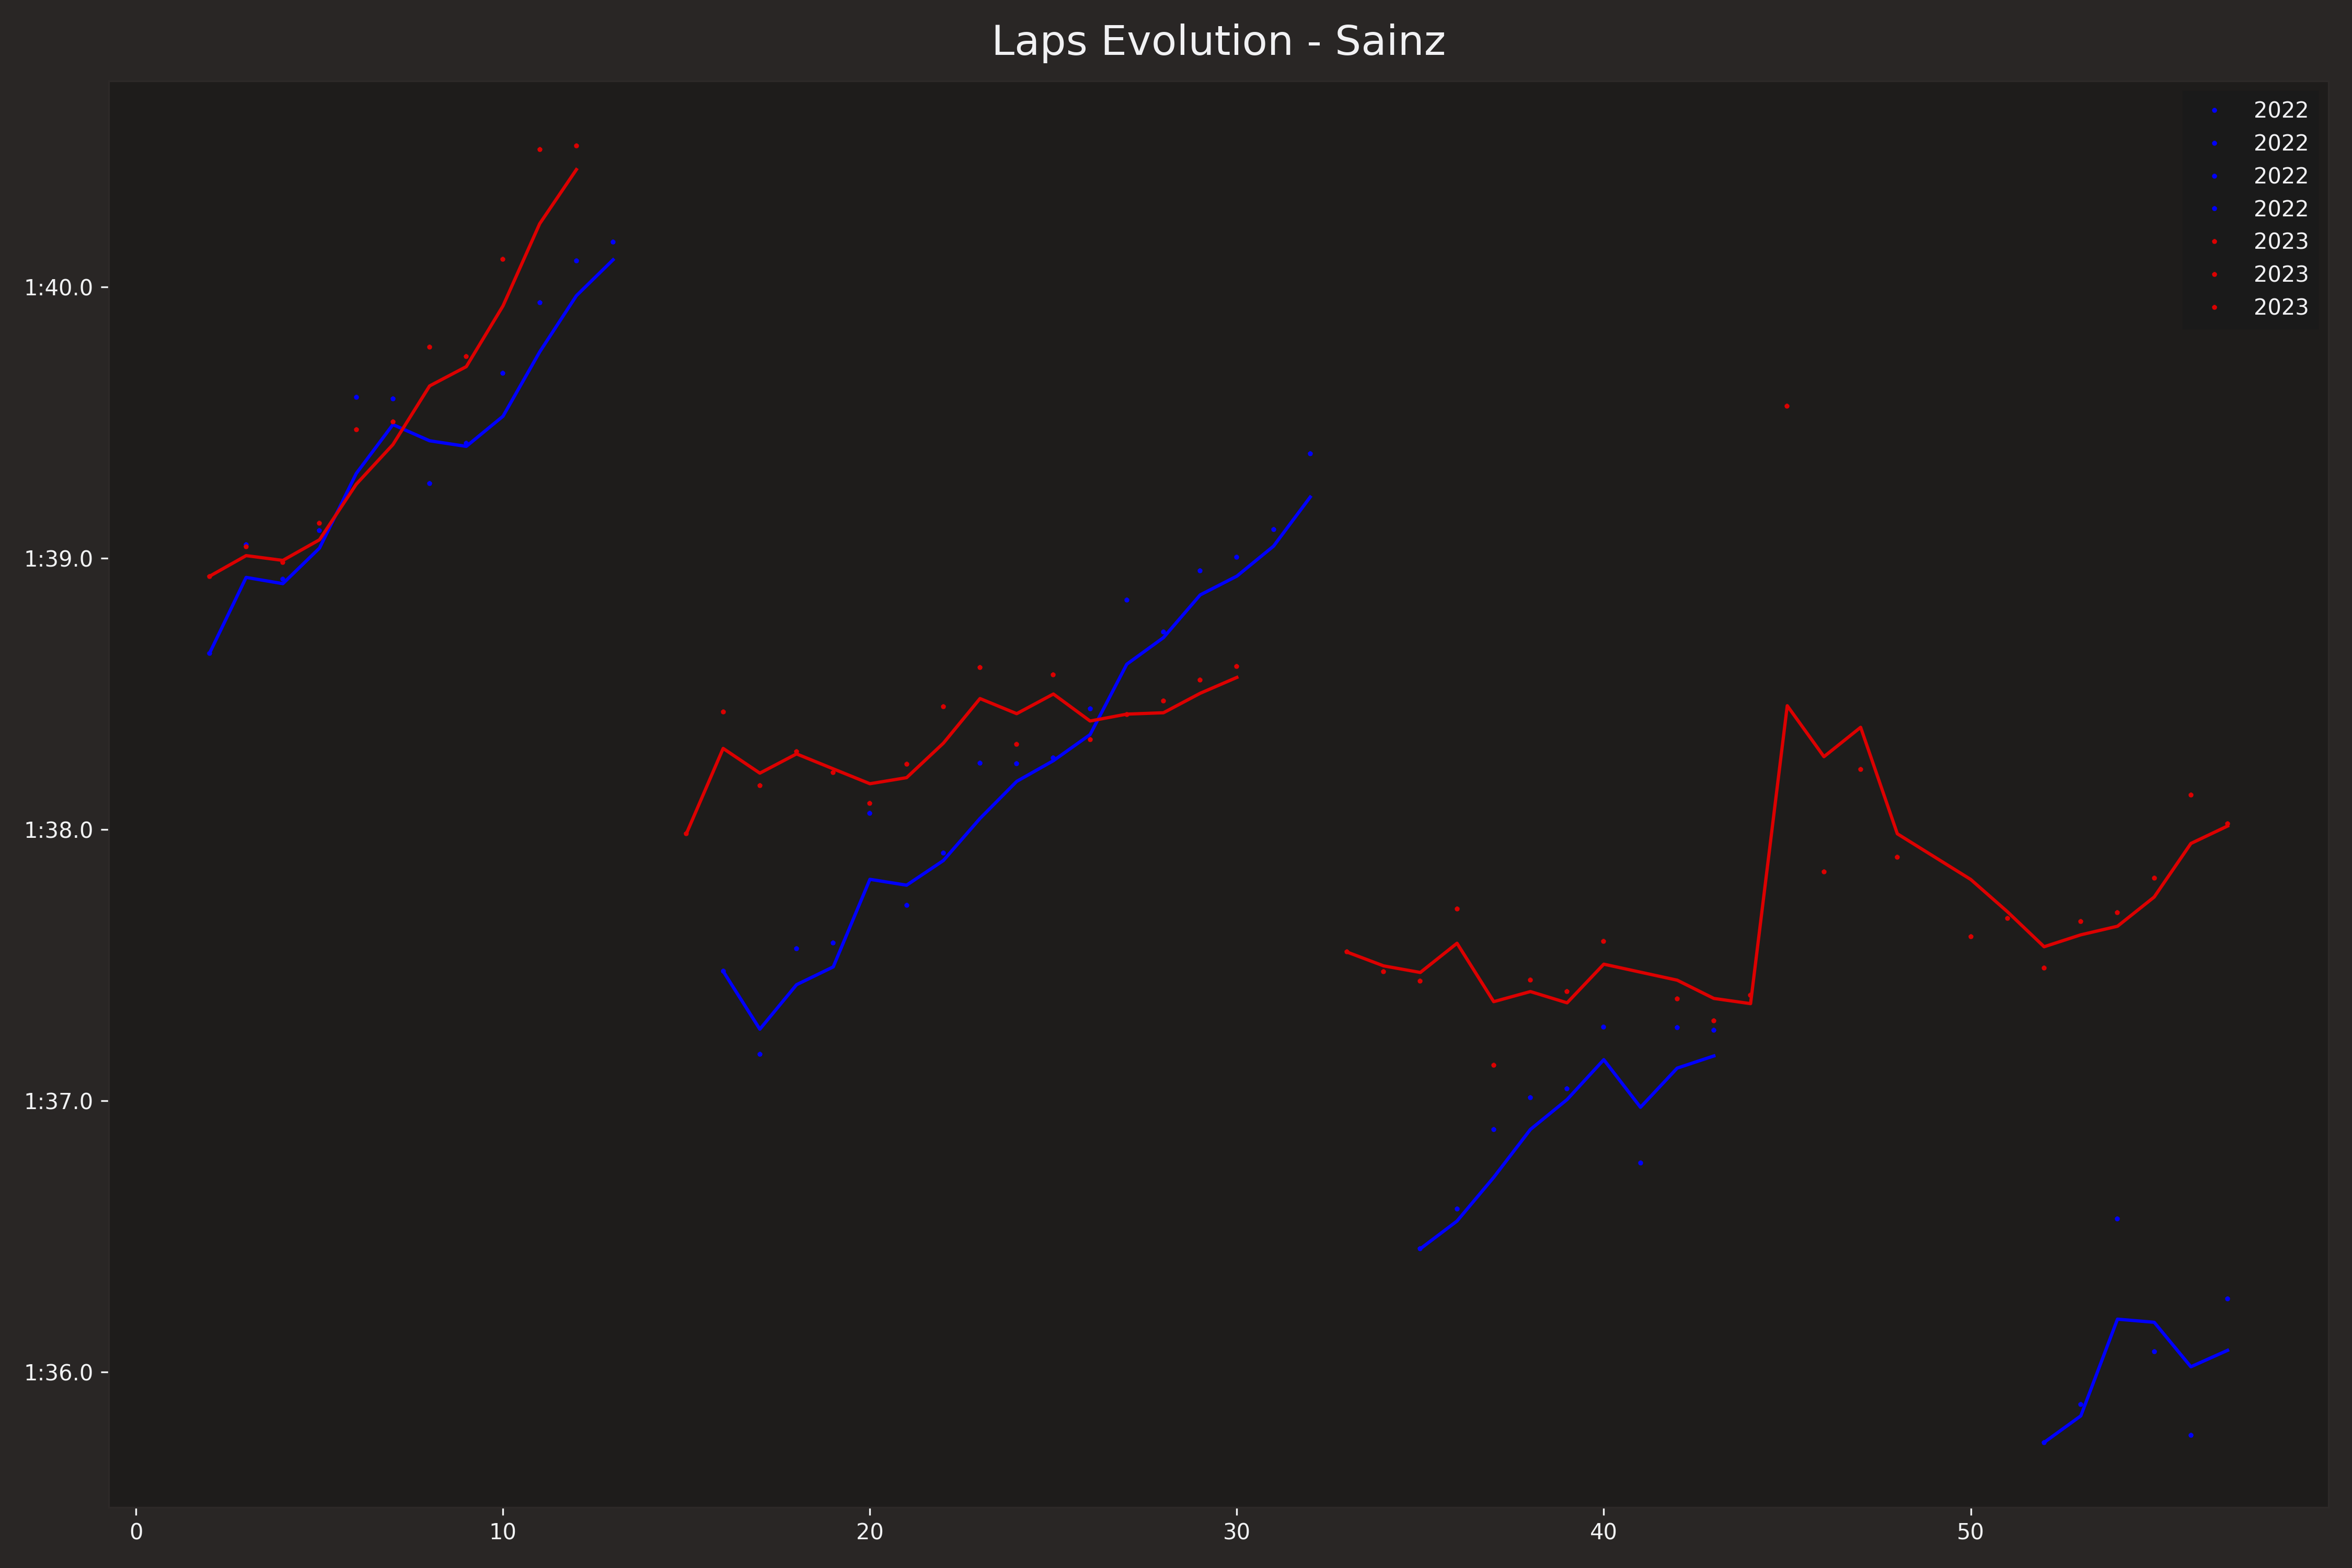 Comparison lap times Sainz 2023 (red) vs 2022 (blue)
Note: Leclerc did not finish the 2022 race.
Note: Sainz last year went all the way to the finish after Verstappen broke, this year he went flat out all the way to the finish.
Last year there was a Safety car that sensibly let the asphalt cool down, save everyone’s tires and charge the battery for the final rush.
We clearly see that the problem with the car is tire degradation. While in 2022 the car was relatively unknown, we already know a lot about the 2023 car. If we consider that the asphalt of Bahrein is the most abrasive of the entire calendar, we can put the Lap Evolution plot of Sainz in perspective. Sainz’s 2023 car, albeit starting second a third stint with a slower pace, managed to keep a steady pace, a synonym that was actively preserving the tires while compromising his race pace (just for example remember Sainz team radio while complaint “I can’t go faster. Tires won’t last”)
Tyre strategy
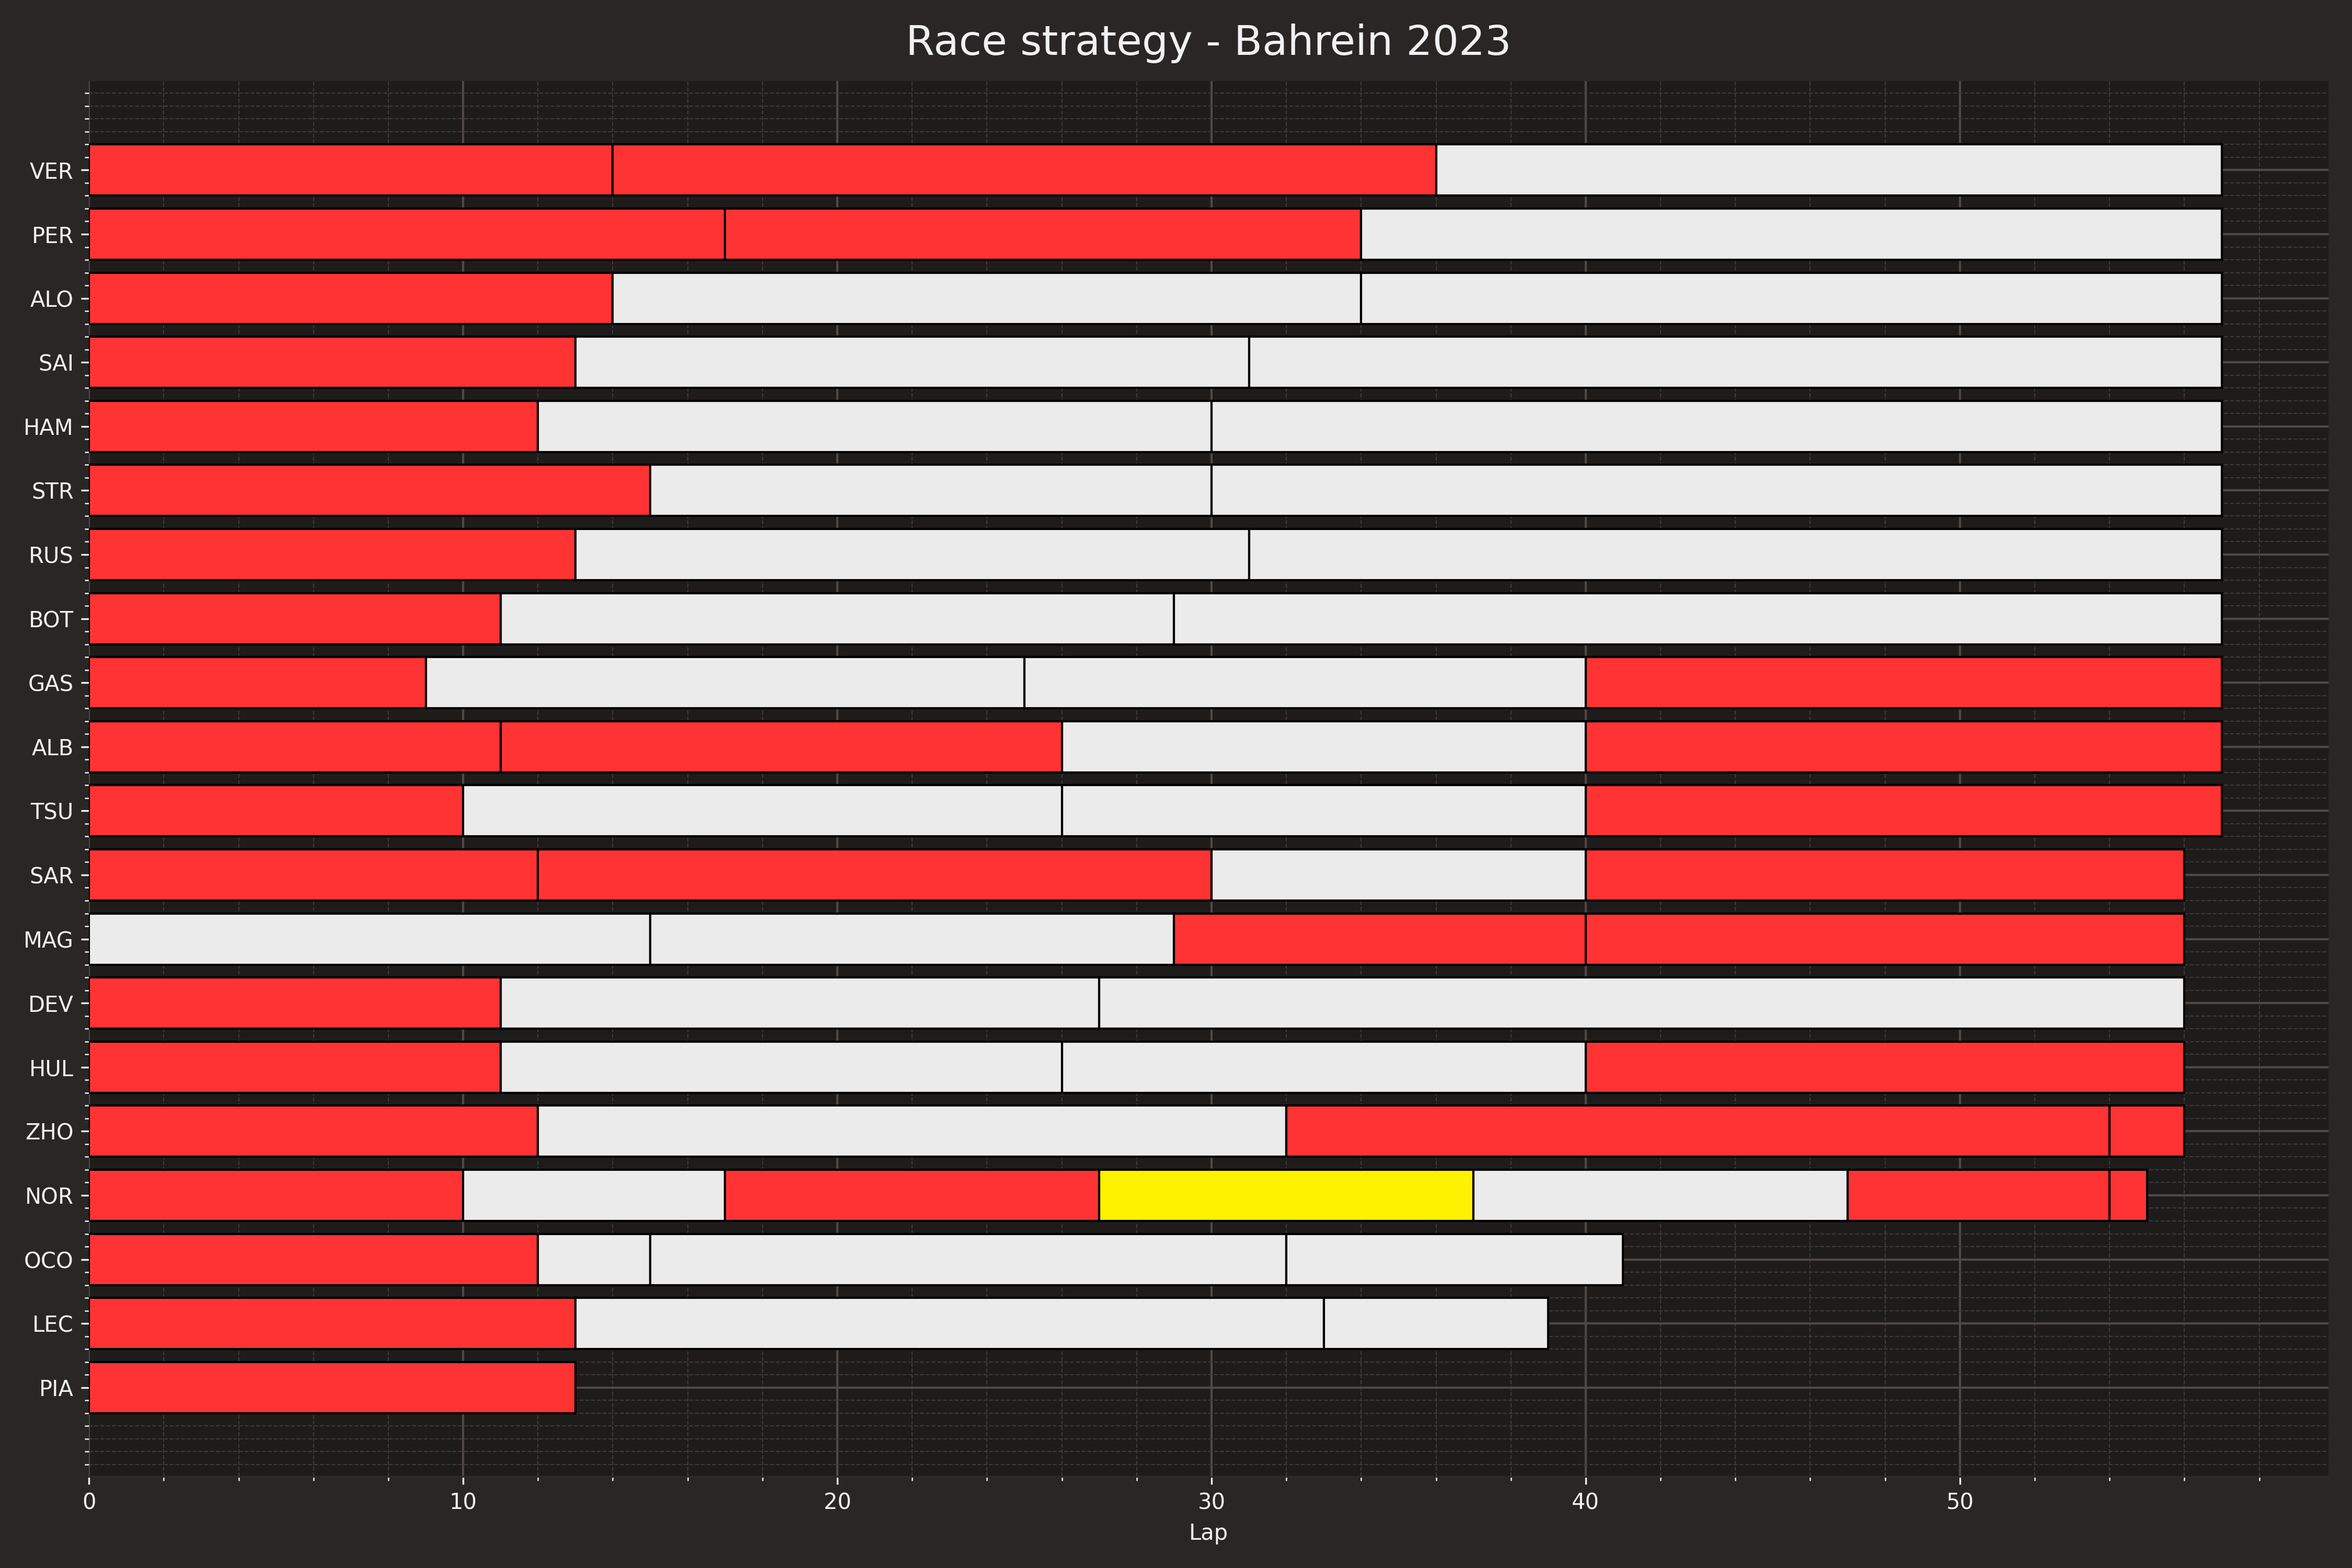 Tyres strategy | White: Hard, Yellow: Medium, Red: Soft
Most noticeable points are Norris’ multiple stops and the Red Bulls’ double-red strategy. Second Stint of Verstappen is absolutely crazy.
I am indepted to Jasper for this plot.
Note: there are many reasons why a driver or car did not achieve their best lap time: stuck behind a slower car, shifted for blue flags, cold tires, preserving fuel and tires, blockages, etc.
Final comments
As many data science projects, the biggest part of the job is absolutely taken by the two following steps:
- (data harvesting and) data cleaning
- data visualization
Other resources
- https://allending.ca/Formula1_RacePace_FastF1
Bibliography
- https://medium.com/towards-formula-1-analysis/visualizing-formula-1-race-strategies-in-python-using-fastf1-pandas-and-matplotlib-95fe6b3298fa